Requirements: none, available to any role.
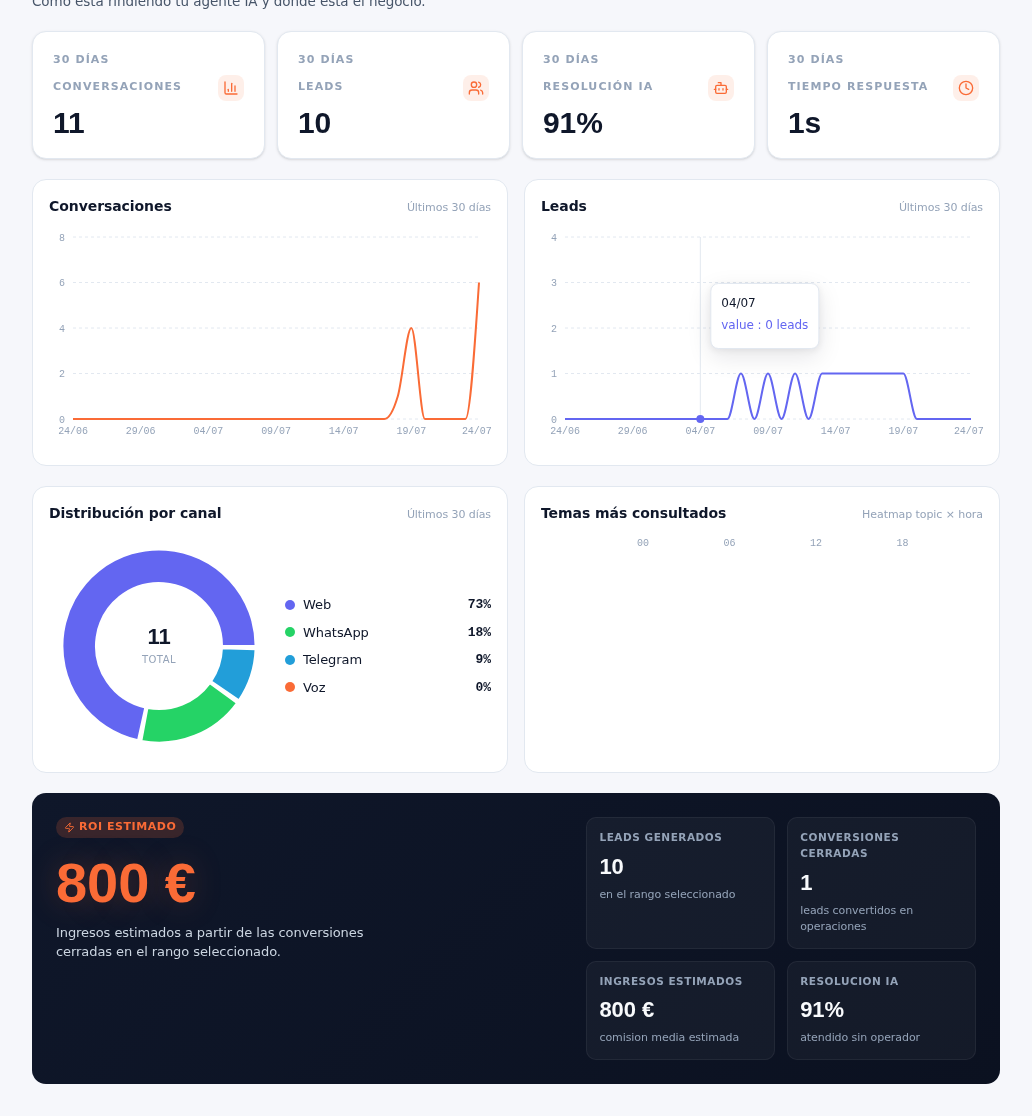
- Scroll down to the “Distribution by channel” panel. The center of the donut shows the period’s total conversations, and the legend on the right breaks down the percentage by channel: Web, WhatsApp, Telegram and Voice, each with its own color.
- Next to it, the “Most-asked topics” panel is a heat map by hour of day (horizontal axis: 00, 06, 12, 18) of the topics your customers ask about most.
Result: you know where most of your conversations come from — useful for deciding where to reinforce attention or promote a channel — and which time slots concentrate the most frequent topics, to anticipate when your team should be paying closer attention to the inbox (manual 16 · Conversations).
If your agency still has a channel not yet connected, it will show up in the breakdown at 0% (for example, “Voice”, for an account that doesn’t have that channel in use yet). The detail of how to connect each channel is in manual 24 · Channels.